
Alanya vs Konyaaltı: Prices and Buyer Guide (2026)
Short Answer: Alanya is the lower-priced option on the portal asking-price sample: its median was ₺6,700,000 and Konyaaltı’s was ₺9,950,000, dated 17 November 2026. PointTurkey marketplace medians were ₺128,000 ($2,541) and ₺140,000 ($2,782) per net m², respectively, on 18 November 2026. Dollar figures are converted at the TCMB rate of ₺50.399 per US dollar on 18 November 2026.
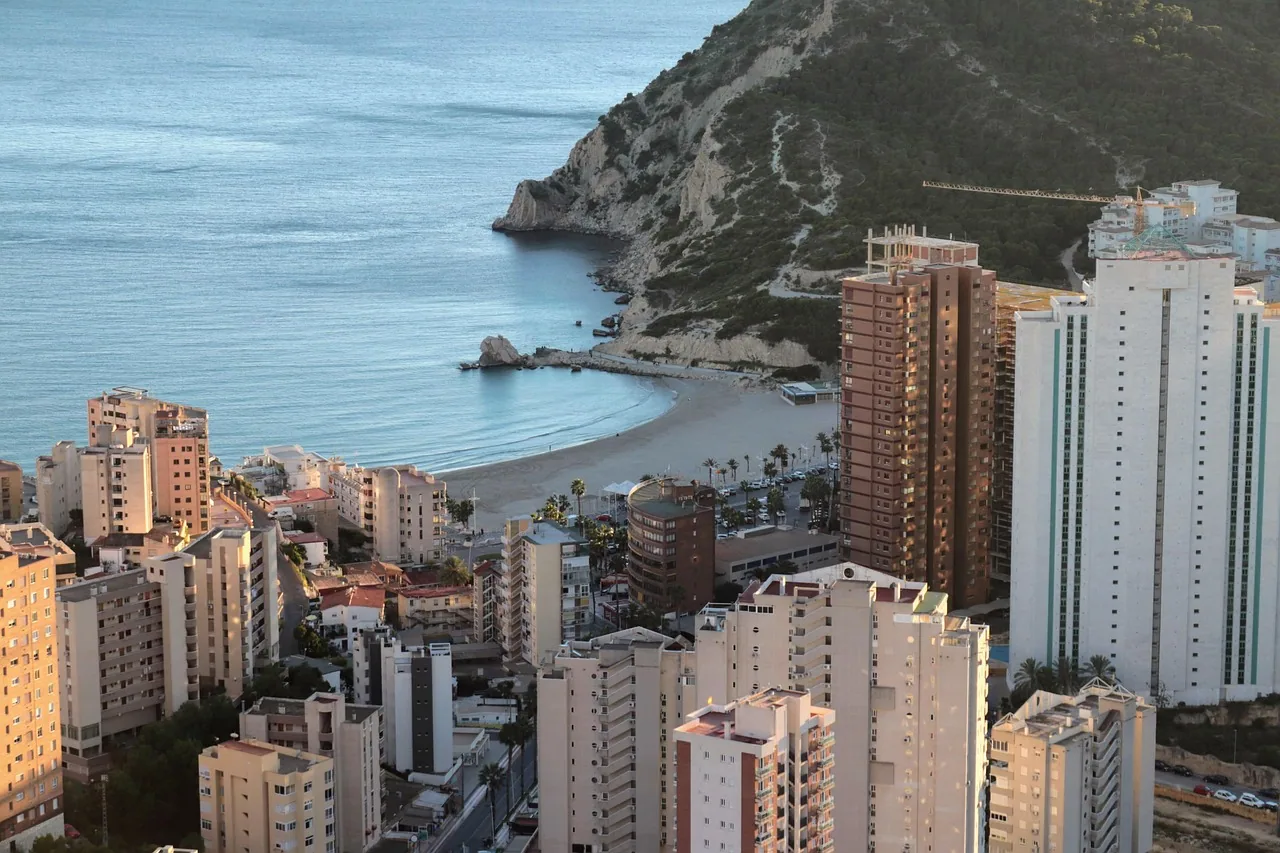
Alanya Vs Konyaaltı At A Glance
These figures compare asking prices, not completed sales. The portal sample covers sale listings, while PointTurkey’s marketplace figures describe asking prices per net m². The two measures use different listing samples and area definitions, so treat them as separate indicators rather than direct equivalents.
As of 17 November 2026, the portal sample contained 4,556 Alanya listings and 1,536 Konyaaltı listings. PointTurkey’s marketplace data, dated 18 November, included 34 Alanya listings and 98 in Konyaaltı. Sample sizes matter when you interpret a median or compare available stock.
| Measure | Alanya | Konyaaltı |
|---|---|---|
| Portal median asking price, 17 November 2026 | ₺6,700,000 | ₺9,950,000 |
| Portal median gross area | 110 m² | 135 m² |
| Portal asking price per gross m² | ₺65,604 | ₺85,811 |
| PointTurkey marketplace median per net m², 18 November 2026 | ₺128,000 ($2,541) | ₺140,000 ($2,782) |
| Portal sale listings in sample | 4,556 | 1,536 |
For a broader search, browse property for sale in Antalya, then narrow your comparison to Alanya homes for sale or Konyaaltı homes for sale. PointTurkey listing prices are asking prices and can differ from final transaction values.
How Much Do Homes Cost In Alanya?
Alanya’s portal median asking price was ₺6,700,000 on 17 November 2026, based on 4,556 listings. The central half of asking prices ran from ₺4,650,000 to ₺10,500,000, so the median is a guide to the sample rather than a quote for a specific home.
The same portal data put the median gross area at 110 m² and the median asking price at ₺65,604 per gross m². On PointTurkey’s marketplace, the median was $2,541 per net m² on 18 November, with a middle range from $1,652 to $2,752 across 34 listings.
Room count changes the comparison. Portal medians on 17 November were ₺4,200,000 for studio/one-room listings, ₺6,580,000 for two-room homes, and ₺11,250,000 for three-room homes. These are category medians across distinct listing samples, not a promise that a particular floor plan will meet that price.
To compare lower asking prices, review Alanya’s lowest-priced listings alongside the standard Alanya property search. If you are comparing an asking price with an expected value, use the free property valuation tool as a separate point of reference.
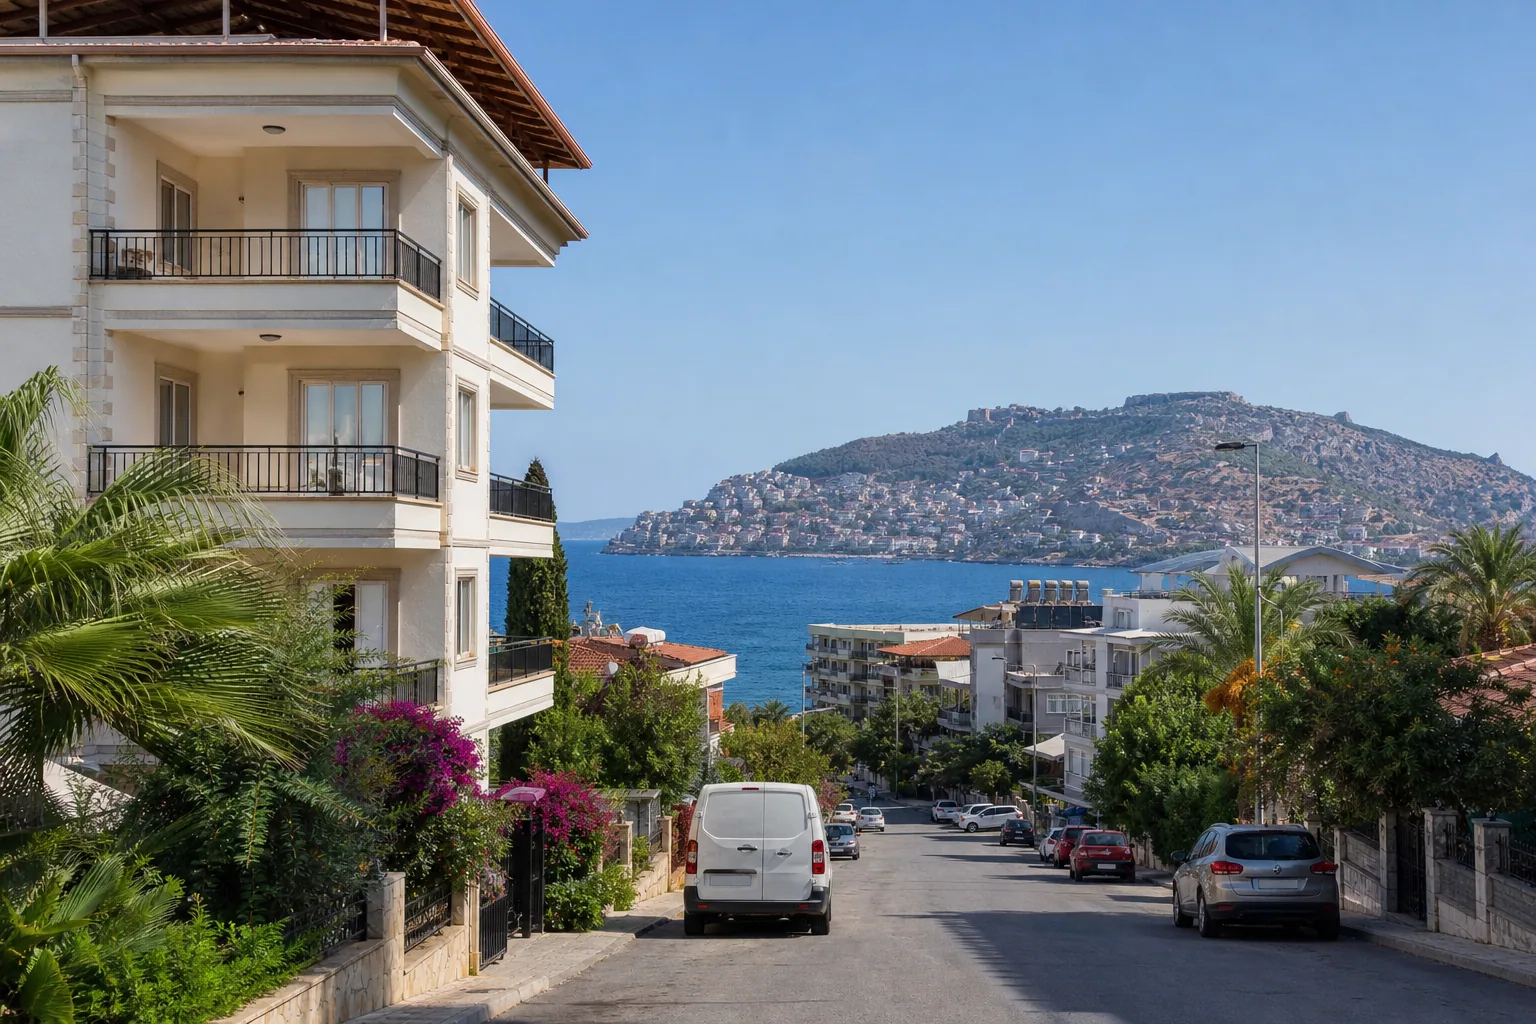
How Much Do Homes Cost In Konyaaltı?
Konyaaltı’s portal median asking price was ₺9,950,000 on 17 November 2026, based on 1,536 listings. The central half ranged from ₺7,450,000 to ₺14,862,500. Its median gross area was 135 m², larger than Alanya’s portal median area in this sample.
The portal median asking price per gross m² was ₺85,811. PointTurkey’s marketplace median was $2,782 per net m² on 18 November, with a middle range of $2,202 to $3,523 across 98 listings. These are separate samples and net and gross area measures should not be mixed.
For room-count context, the portal median on 17 November was ₺5,900,000 for studio/one-room listings, ₺8,500,000 for two-room homes, and ₺11,750,000 for three-room homes. The corresponding sample sizes were 231, 472 and 547 listings, respectively.
Start with homes for sale in Konyaaltı, then compare the lowest-priced Konyaaltı listings. The price range in a search can help you identify candidates, but inspect each home’s condition, location and included features before deciding.
Which Area Offers Better Value?
Alanya looks cheaper by the portal median: ₺6,700,000 compared with ₺9,950,000 for Konyaaltı on 17 November 2026. The same data shows a lower median asking price per gross m² in Alanya. By contrast, the marketplace’s dollar-denominated net-area medians are closer, though Konyaaltı remains higher.
Those differences do not settle value on their own. A property’s price depends on details that district medians cannot capture, including its exact position, condition, building characteristics and views. Compare homes of similar size and type, and keep the source, date and measurement basis attached to each figure.
The short-term marketplace snapshots show changes in asking-price measures, not a forecast. Between 15 October and 18 November 2026, the median asking price per net m² changed in both Alanya and Konyaaltı. These are movements in marketplace asking-price snapshots, not sale-price changes.
For a wider pricing context, read our Antalya district buying guide and check the latest Turkey home-sales report. For comparison beyond Antalya, PointTurkey also lists homes for sale in Istanbul.
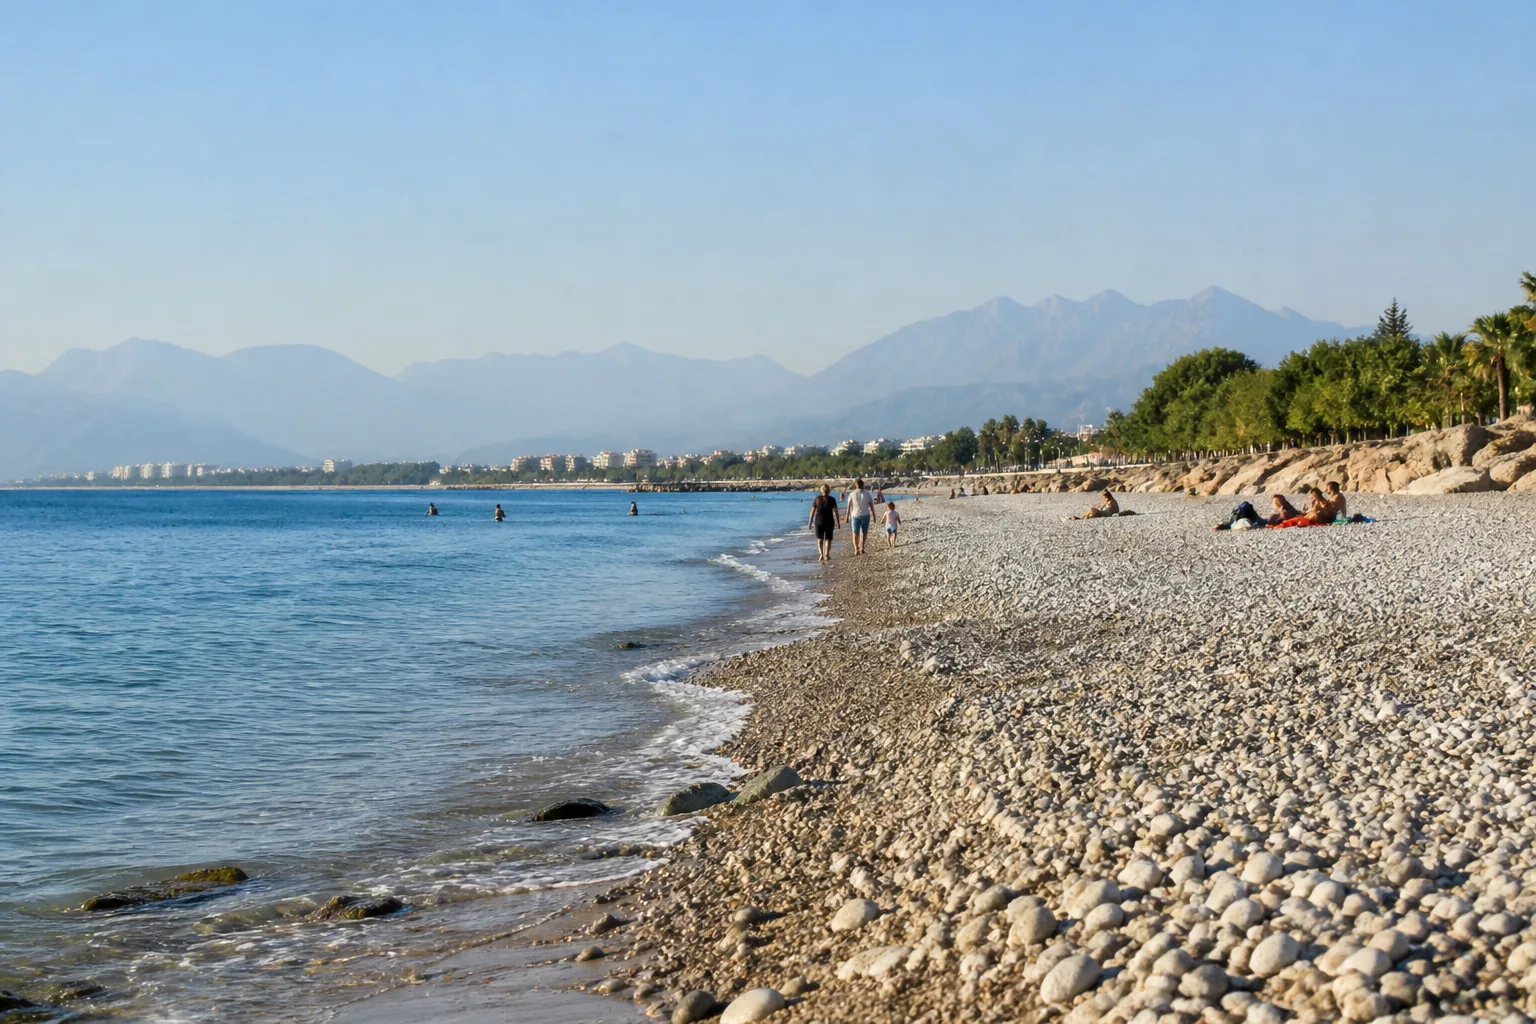
What Do The Available Area Data Tell You?
The available data is more complete for Alanya. OpenStreetMap mapped 449 restaurants, 225 parks, 85 beaches, 271 bus stops and 195 supermarkets within the district boundary as of 18 November 2026. These are mapped-feature counts and represent a lower bound, not a complete inventory.
For Konyaaltı, equivalent OpenStreetMap counts and distance calculations are unavailable. That means a fair numerical comparison of mapped amenities cannot be made. Visit the specific neighbourhoods you are considering and check the facilities and daily routes that matter to you rather than assuming the district-level figures describe every location.
Population figures are available for both districts: Alanya had 371,547 residents and Konyaaltı had 199,414 in the 2025 TUIK ADNKS figures, transcribed on the district table source. These district-wide totals give context, but do not describe the number of people in any particular neighbourhood or building.
School-directory counts also differ in scale: as of 18 November 2026, the MEB directory listed 187 state institutions in Alanya and 59 in Konyaaltı. The directory covers state institutions with an MEB-hosted site; private schools are not included. Do not treat the totals as a complete school-choice comparison.
How Should You Choose Between The Two?
Choose by matching your budget and requirements to individual listings, not by relying on a single district median. Alanya’s portal sample has the lower median asking price, while Konyaaltı’s marketplace median per net m² is higher. Your shortlist may produce a different result once property type and location are controlled.
- Start with budget: Compare like-for-like homes with the same room count and similar area, then check the actual listing price and the basis used for its floor area.
- Check daily needs: Confirm the shops, schools, healthcare and transport options around each specific address. District-wide counts cannot show how close a facility is to the home you are considering.
- Consider your use: A home for year-round living, a holiday base or a possible rental purchase may call for different priorities. Rental figures are not available here, so do not assume an income from the sale-market data.
- Compare the paperwork: Verify the property details and legal status independently before making an offer. If you are looking at other Turkish destinations, browse Bodrum listings, Fethiye listings or homes in Izmir to broaden your search.
PointTurkey’s search also covers apartments, villas and houses. Filtering by property type can help you compare suitable homes across both districts without treating all listings as interchangeable.
What Are The Risks?
Asking prices are not completed sale prices, and the two datasets use different listing pools and floor-area measures. Listings can vary in condition and features, and sample medians do not establish what a specific home is worth. Treat every price as an indicator with its stated date and source.
District-level safety figures and AFAD earthquake-hazard values are not available here, so no conclusion about either district’s safety or hazard is justified. Rental data is also absent. Assess a property individually, obtain appropriate professional checks and do not infer an expected rental return from sale listings.
Marketplace coverage is not the same as total market availability. PointTurkey had no live listings recorded for either district on 18 November 2026, while the other marketplace and portal samples contained listings. Check current availability directly before relying on a search result or market snapshot.
Compare Listings And Take Your Next Step
PointTurkey is a free property marketplace for Turkey, where owners and agents list homes for sale and for rent. Browse property for sale in Turkey or compare citizenship-eligible homes if that filter is relevant to your search. You can also post a free property listing if you are selling.
Ask Amara, PointTurkey’s AI property assistant, to search listings or ask a question about your search.
FAQs: Alanya Vs Konyaaltı
Q: Which district has the lower median asking price?
A: Alanya’s portal median was ₺6,700,000, compared with ₺9,950,000 in Konyaaltı, on 17 November 2026. These are asking prices, not completed sale prices.
Q: Which district has the higher asking price per net square metre?
A: Konyaaltı’s PointTurkey marketplace median was $2,782 per net m², compared with $2,541 in Alanya, as of 18 November 2026.
Q: Which district had more portal sale listings?
A: The portal sample dated 17 November 2026 contained 4,556 Alanya listings and 1,536 Konyaaltı listings. These are sample counts, not a complete live inventory.
Q: Are the price figures sale prices?
A: No. The portal and marketplace figures are asking prices. Final transaction prices can differ.
Q: Are rents available for comparison?
A: No rental figures are available for either district in this comparison. Sale-listing prices should not be used to estimate rent or yield.
Q: Can the data confirm which district is safer or has lower earthquake hazard?
A: No. District safety figures and AFAD hazard values are not available here, so compare properties using appropriate local and professional checks.
NOTE: This article is for information only and is not legal, tax, or investment advice. Figures are as of November 2026.
Related articles
All articles
Bodrum Safety and Earthquake Risk: Buyer Guide 2026
Bodrum has no published district-level crime rate in the available official data, and no public AFAD PGA figure is provided here, so neither can support a precise risk score. Buyers should…

Fethiye Healthcare: Hospitals, Clinics and Pharmacies
Fethiye has 4 mapped hospitals, 5 clinics and 72 pharmacies within its district boundary, based on OpenStreetMap data dated 19 November 2026. These counts indicate mapped facilities, not a…

Istanbul Property Prices: November 2026 District Report
As of the 17 November 2026 listing crawl, the median asking price across Istanbul listings was ₺14,900,000 ($295,600), while the city’s median asking price per m² was ₺132,000 ($2,600). In…